
There are several ways to examine changes over time in any dataset that is available over a range of dates. Here, we describe two of the most effective ways to measure change.
Use Multi-temporal map layer block to visualise change
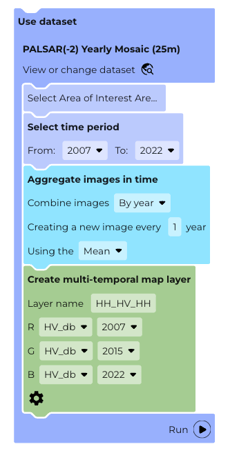
The fastest way to evaluate evidence of change over time is to use the Create multi-temporal map layer block. Instead of assigning three different bands to the Red, Green and Blue channels to create an image it assigns three different dates. In the example below, the RGB channels are three different years of PALSAR mosaic data.
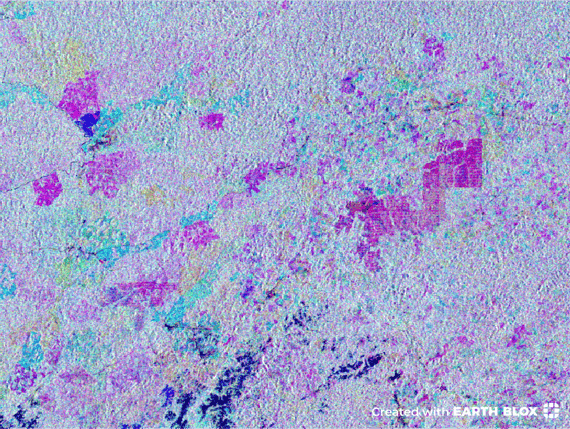
The output highlights areas of change as areas of different colour. Pixels that remain unchanged over the time period selected have the same values in all three of the RGB channels and therefore look white. In the image below, areas of foret clearance for oil palm plantations in Liberia are apparent as different coloured patches.
Using the Calculator block to measure change
The quantitative way to detect change is to use the calculator block to separate out two images from a temporal sequence and compare them. The following workflow is desgined to look at changes in NDVI.
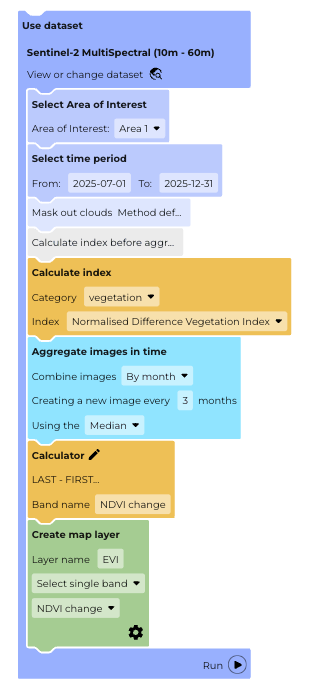
If we examine the Calculator block in more detail, we can see how the change is calculated.
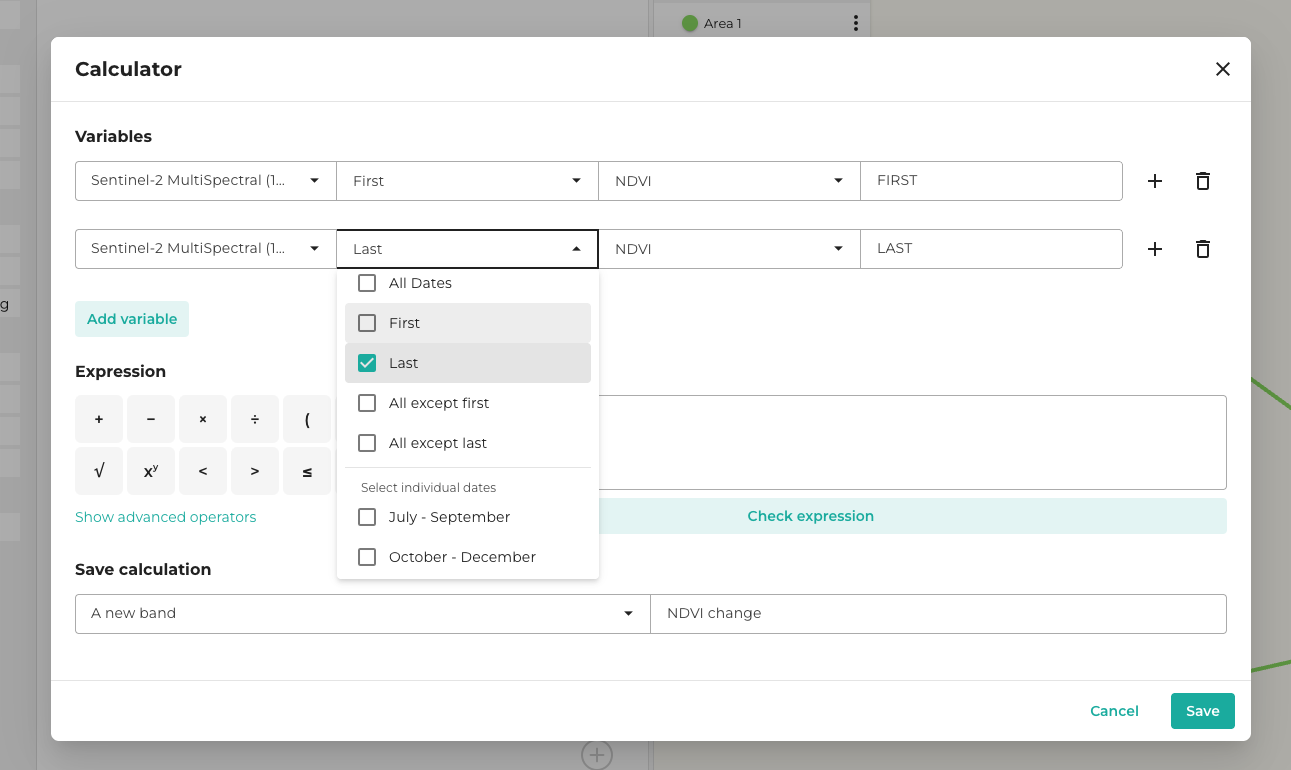
The variables are both chosen from the Sentinel 2 dataset, and the band is both NDVI, but the dates are selected as the First and Last dates in the image series. The difference of these values therefore gives the NDVI change from the month at the beginning of the time series to the month at the end.
The difference is stored in the NDVI change band and then displayed using the Create map layer block.
To see change over multiple dates, use the Create Table block to tabulate and graph the data over time.