Masking is the process by which you remove pixels in an image based on the properties of that data, or the properties of a different data layer. There are multiple ways that masking can be applied.
Mask out clouds block
The built-in cloud masking block masks out (removes) all pixels that contain clouds. That way, any analysis you apply is only done on the cloud-free pixels.
Learn more about the Mask out clouds block
Mask out part of image block
The mask out part of image block allows you to mask out pixels based on a threshold value, or based on the class in a thematic band. Examples include:
- Masking out everything that is not forest cover so that you only analyse forest pixels
- Removing everything but a lake feature so you can analyse only the water properties
- Excluding any pixels above a certain elevation threshold
Learn more about the Mask out part of image block
Masking with the calculator block
Advanced masking can be applied using the calculator block, which is explained below.
Applying masks
Here we focus on how to mask pixels using the Mask out part of image block, but for completeness, we also include a short description of how to do it (and more advanced masking) using the calculator tool.
Masking data in a single workflow
- Within a workflow, add the Mask out part of image block, this is found under Filter in the toolbox
- The block automatically identifies which bands are available and shows them in the drop-down menu
- If you choose a numeric band (e.g. elevation) it will automatically give you numeric options based on criteria (less then, greater than, etc). Enter the number you want as the threshold.
- If you choose a thematic band (e.g. land classification) you will get a drop-down menu that includes all the classes.
- The wording on the block is important: pixels that meet the criteria will be taken out of the data layer.
Masking data from another workflow
- This works in the same way as above, except that the image used to mask is set in a separate workflow
- To do this, use a Save data for re-use block within the workflow that has the dataset you want to use for your mask
- As an example, imagine you wanted to examine some Landsat data, but you only wanted to analyse areas that aren't classed as water:
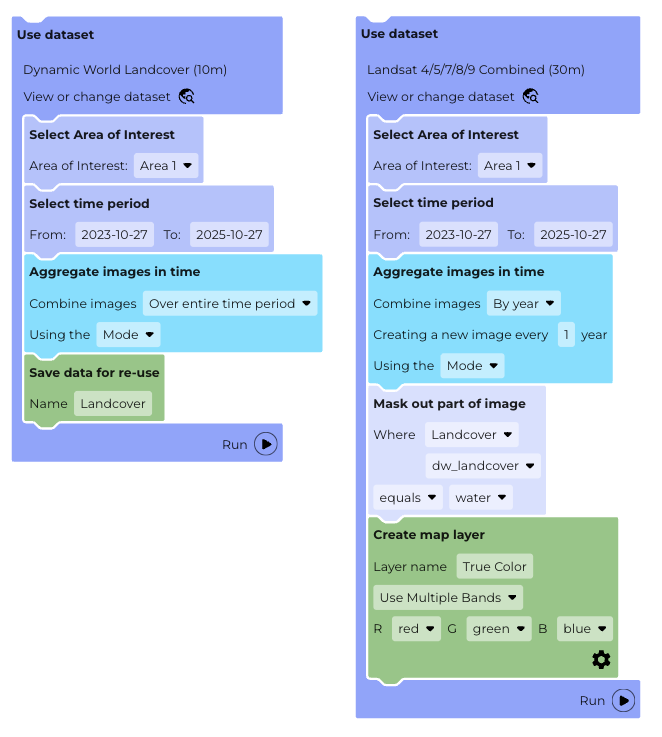
- The first workflow on the left draws in the land cover data to create the masking image, combines it into a single image using the Aggregate image in time block, and saves it for re-use.
- The second workflow on the right brings in the Landsat data that will be masked, and uses the Mask out part of image block to remove any part of the image that is classed as water
The dataset used to mask by must be a single image, or if creating a time series with a dynamic mask, must match the images in the masked dataset exactly.
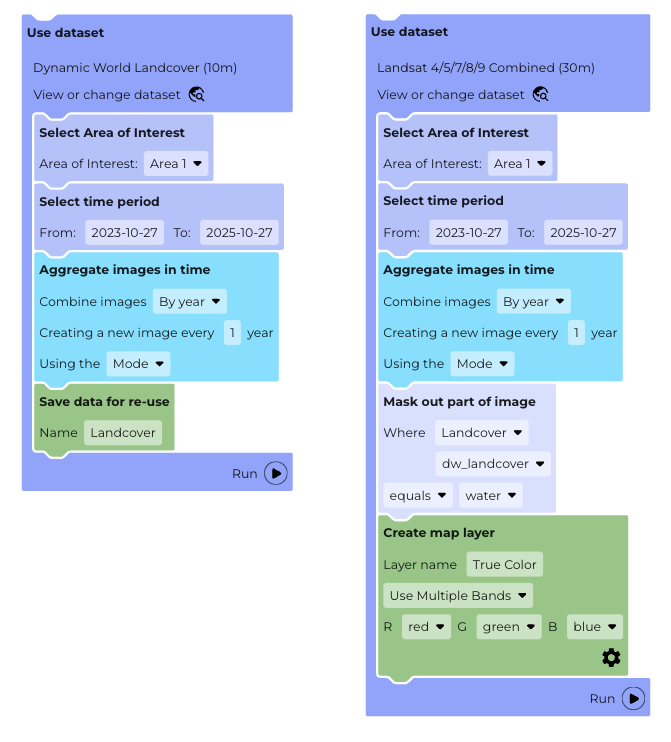
Masking out data in a time series
To create a time series with a dynamic mask (one that changes with each image in the series) you need to make sure that the images match exactly. To do this, make sure that:
- the date ranges in the Select dates block are identical for each dataset
- each Aggregate images in time block is set to use the same time period and number of images
Using the Calculator block to mask out data
Within the calculator block, you can use mask(image1, image2) to apply a mask to image1. If image 2 is an image layer with values from 0-1, then the mask will have varying transparency, with 1=fully opaque (solid colour), and 0 being fully transparent.
Note that "mask" is case sensitive in the calculator block.
You can create the masking image (image2) in one of two ways in the Calculator block:
- The easiest way is to enter a simple Boolean expression, such as DATA > 5 (where DATA is the chosen variable from an available data layer). The output layer will then be a layer that is equal to 1 where the expression is true (in this case, DATA is greater than 5) and zero everywhere else.
- This output layer can then be used as the mask layer, image2, in the expression above as it meets the criteria of being between 0 and 1.
- On its own, this does not have a mask, it merely has a set of zeros and ones. When used with mask(image1, image2) it will mask out all those areas that are not "true".
- Note that this expression can have other Boolean logic expressions such as OR and AND. For example, the expression DATA >= 2 AND DATA <=5 will return 1 for all pixels between 2 and 5, and zero everywhere else.
- You can use the more elaborate IF-THEN-ELSE expression using ? and : so that you will have: DATA >5 ? 1 : 0. The output layer from the Calculator Block is then the same as above.
Was this article helpful?
That’s Great!
Thank you for your feedback
Sorry! We couldn't be helpful
Thank you for your feedback
Feedback sent
We appreciate your effort and will try to fix the article